



BTCUSD Technical Analysis: Key Support and Resistance Levels
Bitcoin (BTCUSD) is trading around $82,547 on the 4-hour chart following a sharp correction from its recent highs. The short-term market structure remains bearish, although the price has started to recover from the $80,365 swing low.
On the upside, $82,977 and $83,593 are the immediate resistance levels to watch, followed by the major resistance at $85,588. A sustained move above $83,593 could strengthen the recovery and bring the higher resistance zone into focus.
On the downside, $82,360 is the immediate support level, followed by $81,727. A break below these levels could expose Bitcoin to another test of $80,365, a key swing low that defines the current 4-hour bearish structure.
For now, BTCUSD remains at a critical technical juncture. A breakout above resistance could support further recovery, while a breakdown below support may signal renewed selling pressure. Traders may benefit from waiting for confirmation before taking a directional position.
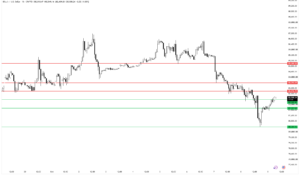
| Resistance | $82,977.00 | $83,593.00 | $85,588.00 |
|---|---|---|---|
| Support | $82,360.00 | $81,727.00 | $80,365.00 |


