


1. What is a Moving Average?
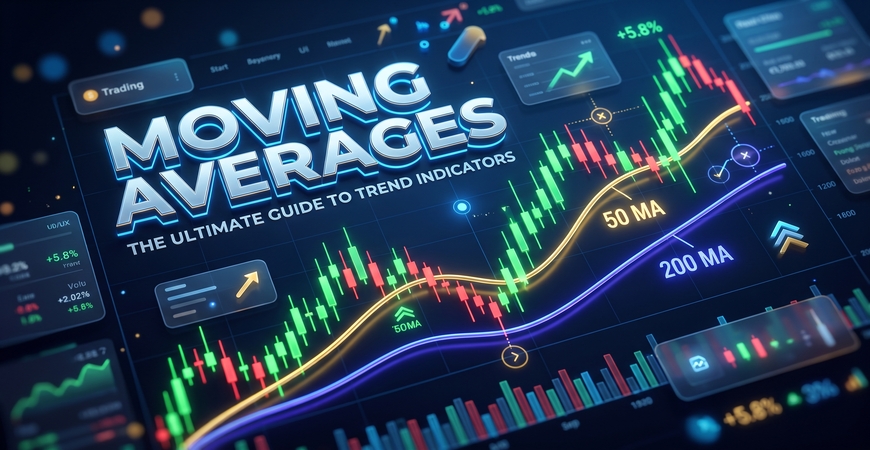
A Moving Average (MA) is a foundational technical analysis indicator that calculates the average price of a financial asset over a specified number of data points (usually closing prices across timeframes such as 20, 50, or 200 periods).
Financial markets generate constant price fluctuations. Raw candlesticks contain significant “market noise”—temporary spikes driven by short-term liquidity sweeps, micro-news releases, and bid-ask spread variance. The moving average acts as a mathematical low-pass filter. By continually smoothing out these erratic fluctuations, it creates a single flowing line that reveals the underlying momentum and market trajectory.
The indicator is termed moving because the calculation window shifts forward with every new bar or candle:
-
As a new time period closes, its price data enters the calculation.
-
The oldest data point drops out of the series.
-
Consequently, the plotted average updates constantly, reacting to market movement while preserving historical context.
Core Characteristics of Moving Averages
-
Lagging Indicator (Trend-Following): A moving average does not predict market turns in advance. Because its formula relies strictly on past closing data, the indicator lags behind current price action. It confirms established trends rather than forecasting tops or bottoms.
-
Baseline of Market Balance: Price tends to fluctuate around its mean. When price stretches too far from its moving average, it is considered overextended; when momentum stalls, price frequently retraces back to touch the average line.
-
Dynamic Support and Resistance: Unlike static horizontal price levels, moving averages recalculate constantly, serving as sloping, dynamic boundary zones where institutional orders often re-enter the market.
2. Overview: The Core Types of Moving Averages
Traders use different mathematical models depending on their required speed, sensitivity, and trading style. The primary moving averages utilized in modern charting software include:
3. Simple Moving Average (SMA): In-Depth Technical Breakdown
The Simple Moving Average (SMA) is the most traditional trend-following indicator in technical analysis. It represents the unweighted arithmetic mean of closing prices over a selected period of time (n).
Because each candle in the chosen window carries identical mathematical weight (for example, each bar represents exactly 5% in a 20-period SMA), the line adjusts smoothly. This makes the SMA the primary baseline used by institutional market participants to track broader market direction.
Formula and Step-by-Step Calculation
The formula adds the closing prices over the specified period and divides the sum by that total number of periods:
– P = Closing price of each period
– n = Total number of calculation periods (such as 20, 50, or 200)
Step-by-Step Manual Example (5-Period SMA on EUR/USD):
Calculation Example:
Suppose the last 5 daily closing prices are: 1.0820, 1.0840, 1.0810, 1.0870, 1.0890.
SMA (Day 5) = 5.4230 / 5 = 1.0846
When Day 6 closes at 1.0920, the oldest price (1.0820) drops off:
SMA (Day 6) = 5.4330 / 5 = 1.0866
Key Institutional SMA Periods
Core Trading Strategies Using SMA
-
1. Dynamic Support and Resistance
-
In an established uptrend, price typically remains above an ascending 50 or 200 SMA. Pullbacks toward the average line offer structured re-entry opportunities.
-
In a confirmed downtrend, price stays below a sloping 50 or 200 SMA. Retests of the line provide dynamic resistance for short positions.
2. The Golden Cross and Death Cross
-
Golden Cross: Forms when the 50 SMA crosses above the 200 SMA on the Daily timeframe. It signals a long-term transition into bull territory.
-
Death Cross: Forms when the 50 SMA crosses below the 200 SMA on the Daily timeframe. It indicates broad institutional selling and the onset of a macro downtrend.
-
Strengths and Weaknesses of SMA
Strengths:
-
High market reliability due to widespread institutional tracking on higher timeframes.
-
Filters out sharp, short-term market noise and false breakouts.
Weaknesses:
-
Significant calculation lag; waiting for confirmation can result in late entries.
-
Equal weighting causes old price spikes to affect the average twice: once when they occur, and again when they drop out of the calculation window.
4. Exponential Moving Average (EMA): In-Depth Technical Breakdown
The Exponential Moving Average (EMA) is a weighted moving average designed to reduce lag. Unlike the Simple Moving Average, which treats every candle equally, the EMA places greater weight and significance on the most recent price points.
Because newer market data receives exponential priority, the indicator reacts much faster to sudden price expansions, volatile spikes, and early momentum shifts. For this reason, the EMA is the standard trend indicator preferred by day traders, scalpers, and short-to-medium-term momentum swing traders.
Mathematical Formula and Weighting Multiplier
Calculating an EMA involves three sequential steps:
-
Calculate the Simple Moving Average for the initial baseline period.
-
Calculate the weighting multiplier (smoothing factor).
-
Apply the exponential formula for each subsequent period.
– n = Total number of calculation periods
– Current Price = Most recent closing price
– Previous EMA = The calculated EMA value of the preceding candle
Step-by-Step Manual Example (10-Period EMA Calculation):
Calculation Example:
Assume a 10-period EMA where yesterday’s EMA closed at 1.1000, and today’s price closes at 1.1050.
Step 1 (Multiplier) = 2 / (10 + 1) = 2 / 11 = 0.1818 (18.18%)
Step 2 (EMA Calculation):
EMA = (1.1050 – 1.1000) * 0.1818 + 1.1000
EMA = (0.0050 * 0.1818) + 1.1000
EMA = 0.000909 + 1.1000 = 1.1009
Key Trading EMA Periods
Core Trading Strategies Using EMA
1. The 9 / 21 EMA Trend-Following Cross
-
Bullish Signal: The 9 EMA crosses above the 21 EMA while both lines slope upward. This signals accelerating buying volume and prompts long entries.
-
Bearish Signal: The 9 EMA crosses below the 21 EMA while sloping downward. This signals strong seller presence and prompts short entries.
-
Trailing Stop Execution: In aggressive trends, traders trail stop-loss orders just below the 21 EMA line, exiting only when a candle closes on the opposite side.
2. EMA Dynamic Pullback Entries
-
Rather than chasing green candles during a breakout, traders wait for price to retrace into the value zone between the 20 EMA and 50 EMA.
-
Reversal candlestick patterns (such as pin bars, hammers, or engulfing candles) forming inside this zone confirm that buyers are defending the dynamic moving average.
Strengths and Weaknesses of EMA
Strengths:
-
Substantially lower lag compared to SMA; reacts rapidly to sudden market volatility and breakouts.
-
Provides closer dynamic trailing stop levels for locking in profit during steep price runs.
Weaknesses:
-
Highly vulnerable to false breakouts (“whipsaws”) during sideways, consolidating, or range-bound markets.
-
Requires supplementary confirmation tools (such as horizontal support/resistance or volume indicators) to avoid false entries.
5. Weighted Moving Average (WMA): In-Depth Technical Breakdown
The Weighted Moving Average (WMA) assigns a linearly decreasing weight to price points within the calculation window. While the EMA applies an exponential curve that never fully reaches absolute zero, the WMA uses a strictly linear progression: the most recent bar receives the heaviest weight, and each preceding bar receives proportionally less weight.
This linear design makes the WMA track rapid price turns and acceleration phases with extreme sensitivity, turning faster than an SMA and often hugging price action even tighter than an EMA during initial breakouts.
Mathematical Formula and Weighting Progression
The formula multiplies each price by an assigned numerical weight (from 1 up to n) and divides the total sum by the triangle number (the sum of all weights):
– Pn = Most recent closing price (multiplied by n)
– P1 = Oldest closing price in window (multiplied by 1)
– n = Total number of periods
Step-by-Step Manual Example (5-Period WMA Calculation):
Suppose 5 daily closes: Day 1 (10), Day 2 (11), Day 3 (12), Day 4 (11), Day 5 (13).
Sum of Weights = 1 + 2 + 3 + 4 + 5 = 15
Weighted Prices:
(10 * 1) + (11 * 2) + (12 * 3) + (11 * 4) + (13 * 5)
= 10 + 22 + 36 + 44 + 65 = 177
WMA = 177 / 15 = 11.80
Comparison: SMA vs. EMA vs. WMA
Core Trading Strategies Using WMA
1. Early Reversal Detection with WMA-SMA Crossover
-
Because the WMA reacts to direction changes much faster than the SMA, traders pair a fast WMA (such as 20 WMA) with an equal-period 20 SMA.
-
When the 20 WMA crosses above the 20 SMA, it signals immediate upward acceleration before the standard moving average detects it.
-
A cross below warns of early liquidity exits and trend exhaustion.
2. Building Block for Advanced Indicators (Hull Moving Average)
-
The WMA serves as the core mathematical component for advanced composite moving averages like the Hull Moving Average (HMA), which calculates differences between halved and full-length WMAs to eliminate lag entirely.
Strengths and Weaknesses of WMA
Strengths:
-
Turns faster than both SMA and EMA when momentum shifts sharply.
-
Accurately reflects sudden changes in short-term buying or selling aggression.
Weaknesses:
-
Higher frequency of false signals during low-volume or sideways periods.
-
Less widely watched by traditional retail and institutional participants compared to standard 50/200 SMA and EMA levels.
6. Advanced Moving Averages: DEMA, TEMA, HMA, and VWMA
Standard moving averages inherently force traders to accept a compromise between lag and smoothness: making an indicator smoother increases its delay, while making it faster increases market noise. Modern quantitative techniques solve this tradeoff using multi-layered calculations, square-root smoothing, and volume integration.
The four most widely implemented advanced moving averages are:
-
DEMA (Double Exponential Moving Average)
-
TEMA (Triple Exponential Moving Average)
-
HMA (Hull Moving Average)
-
VWMA (Volume-Weighted Moving Average)
1. DEMA and TEMA: Eliminating Calculation Lag
Developed by Patrick Mulloy in 1994, DEMA and TEMA do not simply apply an EMA twice or three times (which would actually double or triple the lag). Instead, they calculate the difference between single and double-smoothed EMAs, subtracting the built-in mathematical delay from the price curve.
– EMA1 = Standard EMA of the price
– EMA(EMA1) = An EMA calculated over the values of EMA1 (second smoothing layer)
– EMA(EMA(EMA1)) = Third smoothing layer applied to the second EMA
Best Application: Algorithmic trading systems, high-frequency scalping, and volatility breakout indicators.
2. Hull Moving Average (HMA): Ultra-Smooth and Responsive
Developed by Alan Hull, the Hull Moving Average achieves almost zero lag while producing a remarkably smooth curve. It combines two Weighted Moving Averages (one with half the chosen period and one with the full period), then applies an additional WMA over the square root of the period.
– WMA(n/2) = Weighted Moving Average over half the selected period
– WMA(n) = Standard Weighted Moving Average over the full period
– sqrt(n) = Integer square root of the total period (e.g., sqrt(16) = 4)
Best Application: Directional bias identification and trend-color flipping systems (green when sloping up, red when sloping down).
3. Volume-Weighted Moving Average (VWMA): Incorporating Market Liquidity
Traditional moving averages evaluate only closing prices, regardless of whether 100 contracts or 100,000 contracts were traded on that bar. The Volume-Weighted Moving Average (VWMA) weights each candle’s closing price proportional to its actual trading volume.
When heavy institutional volume pushes the market, the VWMA pulls sharply toward that expansion move. During low-volume consolidations, the line flattens out, exposing fake breakouts.
Sum of (Closing Price multiplied by Volume for each candle) divided by the total accumulated volume over those same n candles.
Advanced Moving Averages Comparison
Core Trading Strategies Using Advanced MAs
1. The VWMA / SMA Divergence Setup (Validating Real Breakouts)
-
Plot a 20-period SMA and a 20-period VWMA on the same chart.
-
When price breaks through a major resistance level, observe the positioning of both lines:
-
True Breakout: The VWMA crosses decisively above the SMA. This confirms high-volume institutional participation powering the rally.
-
Fakeout (Bull Trap): Price moves up but the VWMA lags below the SMA. This indicates weak volume and high likelihood of a swift reversal.
-
2. HMA Slope Reversal Strategy
-
Plot an HMA (period 20 or 55).
-
When the curve transitions from a downward slope to an upward curve, open a long position with a stop-loss directly under the swing low.
-
Exit the trade immediately once the HMA curve starts to flatten or turn downward.
7. Multi-Timeframe Analysis and Trading Best Practices
Moving averages perform best when applied within a top-down, multi-timeframe framework. Relying on a single moving average crossover on a single chart often leads to poor trade execution during low-volatility periods.
Professional traders use higher timeframes to determine macroeconomic direction and lower timeframes to time precise entries.
The Triple-Barrier Alignment Strategy
To filter out false signals and trade in alignment with institutional flow, apply the following three-step alignment:
-
Macro Trend (Daily or 4-Hour Chart): Use the 200 SMA or 50 EMA to determine the primary market bias. If price is trading above the 200 SMA, take long positions only. If price is trading below, prioritize short setups.
-
Dynamic Value Zone (1-Hour Chart): Identify pullbacks into the dynamic space between the 20 EMA and 50 EMA. This area represents fair value within an ongoing trend.
-
Execution Trigger (15-Minute or 5-Minute Chart): Enter the trade when a faster moving average (such as the 9 EMA or 20 WMA) crosses back in the direction of the macro trend, accompanied by a confirming candlestick reversal pattern.
Common Moving Average Mistakes and How to Avoid Them
Critical Trading Rules:
- Avoid Indicator Clutter: Do not load more than two or three moving averages on the same chart. Layering multiple variations causes analysis paralysis.
- Sideways Market Caution: Moving averages fail during consolidating, horizontal ranges. If the lines flatten out and price oscillates back and forth across them, stop taking crossover trades.
- Never Trade MAs in Isolation: Always combine moving averages with static horizontal support/resistance levels, order blocks, or liquidity zones.
- Account for Market Lag: Remember that moving averages reflect historical data. Always define stop-loss levels based on market structure rather than relying solely on a delayed cross back.
Moving Average Decision Checklist
Use this quick-reference matrix to select the ideal moving average based on your trading style:
Conclusion
Moving averages remain among the most practical and dependable tools in modern technical analysis. While the SMA provides the baseline for macro institutional sentiment, the EMA and WMA deliver the responsiveness required for intraday trading, and modern formulations like HMA and VWMA incorporate reduced lag and volume data.
By combining trend confirmation on higher timeframes with disciplined risk management and dynamic support/resistance pullbacks, traders can effectively filter out short-term market noise and align their positions with the broader market trajectory.


