



Gold (XAU/USD) Technical Analysis: Key Support and Resistance Levels
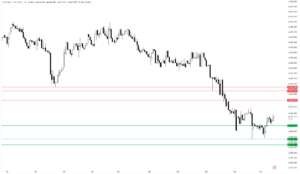
Gold (XAU/USD) is trading around $4,017.63 on the 4-hour chart after bouncing from a recent low of $3,975.65. Despite this recovery, the broader technical structure remains bearish.
On the downside, $4,000.92 is the first support level, followed by $3,975.65 and $3,965.28. A break below $3,975.65 could expose gold to further downside pressure.
On the upside, $4,048.55–$4,057.55 represents a key resistance zone, followed by $4,066.53 and $4,073.55. A sustained break above these levels could signal a stronger recovery.
Gold remains under bearish pressure, with a broader decline of approximately 8.38% over the observed 300-bar period. Traders may watch the $4,048–$4,066 zone for signs of rejection or a potential breakout.
| Resistance | $4,073.55 | $4,066.53 | $4,048.55 |
|---|---|---|---|
| Support | $4,000.92 | $3,975.65 | $3,965.28 |


